Performance Testing
Run load tests against a single request or an entire collection/folder, directly from the extension. Simulate multiple concurrent users, ramp load up gradually, sustain traffic for a fixed duration, and see response-time percentiles, throughput, and error rates as the test runs.
📂 Opening the Performance Test panel
You can start a performance test from either level of your workspace:
| Entry point | Resulting scope |
|---|---|
| Right-click a Collection or Folder → Tools → Performance Test | Whole Collection / Folder (you choose which requests to include) |
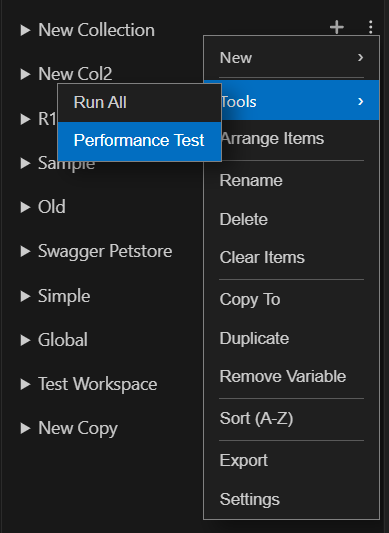
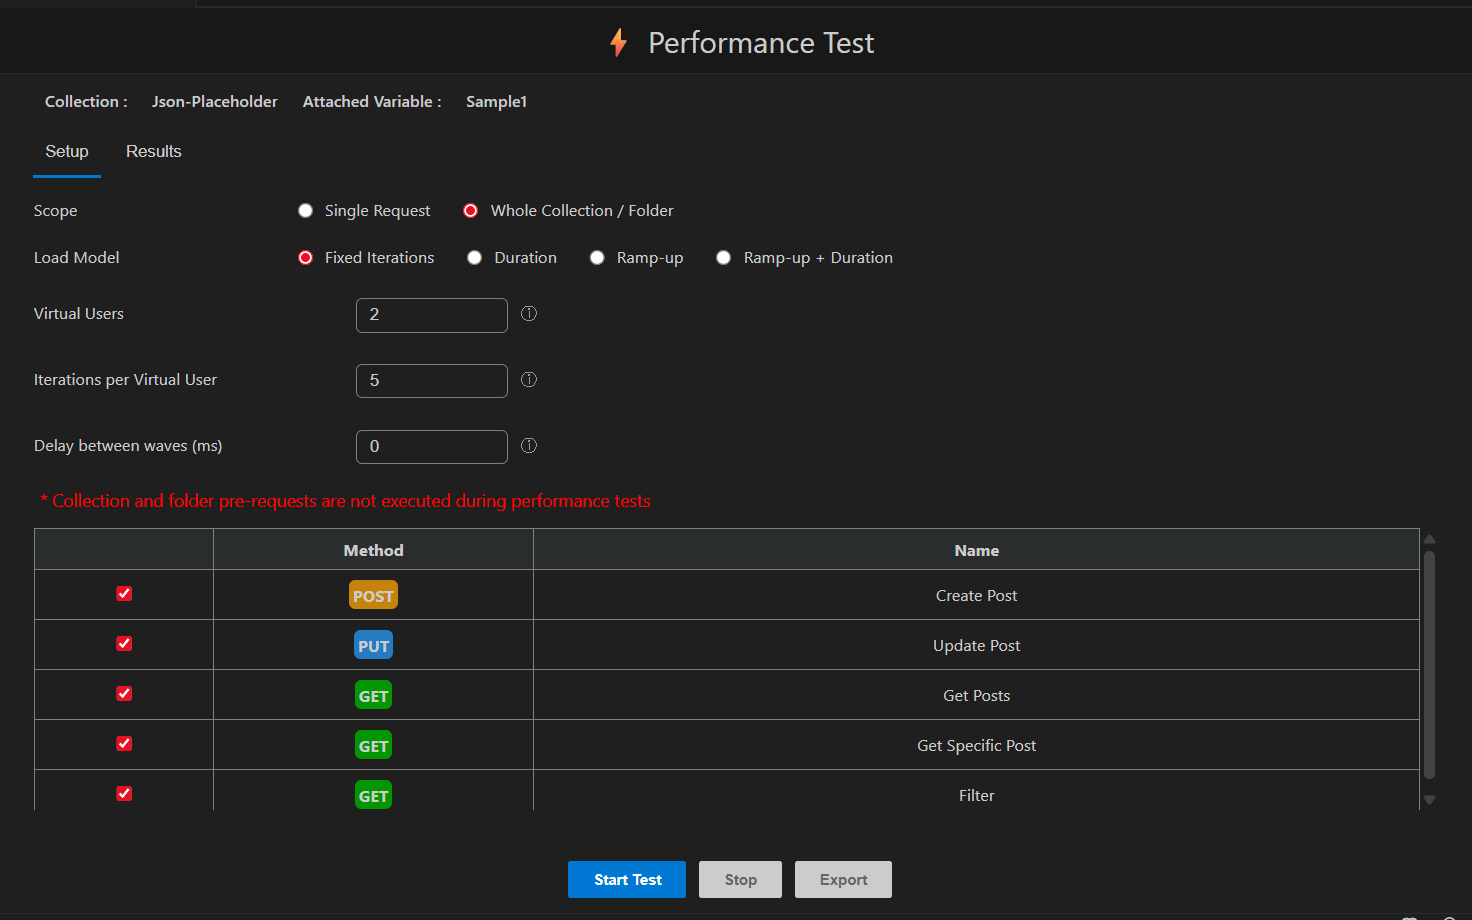
The panel opens with two tabs: Setup (configure the test) and Results (live dashboard, populated once you start).
🎯 Choosing a scope
- Single Request - every virtual user repeatedly calls one endpoint. Best for isolating how a specific API holds up under load.
- Whole Collection / Folder - every virtual user runs through all the selected requests in the collection, concurrently with every other virtual user. Use the checkbox table in Setup to include/exclude individual requests.
Note: Collection/Folder pre-request scripts do not run during a performance test. Requests execute directly, without pre-request setup, to keep load generation predictable and avoid it becoming a bottleneck itself.
⚙️ Load models
The load model controls how many concurrent virtual users (VUs) are hitting your endpoint(s) at any given moment, and when the test stops. There are four:
1. 🔄 Fixed Iterations
A constant number of virtual users repeats the request(s) a set number of times, then the test ends.
- Virtual Users - how many run concurrently, every round.
- Iterations per Virtual User - how many rounds each virtual user completes.
Use this when you want a predictable, repeatable test - e.g. "50 users, 20 requests each, every time I run this."
2. ⏱️ Duration
A constant number of virtual users keeps sending requests continuously until a time limit is reached.
- Virtual Users - concurrency level, held steady for the whole test.
- Test Duration (sec) - how long the test runs.
Use this for a steady-state soak test - e.g. "hold 30 concurrent users for 5 minutes and see if performance degrades or errors creep in over time."
3. 📈 Ramp-up
Concurrency starts low and increases in steps until it reaches your target, then the test stops as soon as the ramp finishes.
- Target Virtual Users - the concurrency level to ramp up to.
- Ramp-up Duration (sec) - total time to go from 1 user to the target.
- Ramp-up Steps - how many increments to take getting there (e.g. 5 steps to reach 50 VUs = roughly 10, 20, 30, 40, 50).
Use this to find where things start to break - e.g. "gradually increase load and tell me at what concurrency response times spike or errors begin."
4. 📊 Ramp-up + Duration
Combines the two: ramps up exactly like Ramp-up mode, but instead of stopping once it reaches target concurrency, it holds there for an additional duration.
- Target Virtual Users, Ramp-up Duration (sec), Ramp-up Steps - same as Ramp-up.
- Hold Duration after ramp-up (sec) - how long to sustain peak load once the ramp completes.
Use this for the most realistic production-like load test - e.g. "ramp up to 100 users over 2 minutes, then hold 100 users for 10 minutes."
📝 Settings reference
| Setting | Applies to | Description | Max |
|---|---|---|---|
| Virtual Users / Target Virtual Users | All | Number of concurrent simulated users | 50 |
| Iterations per Virtual User | Fixed Iterations | Rounds each VU completes before stopping | 1000 |
| Test Duration (sec) | Duration | How long to hold steady-state load | 3600 |
| Hold Duration after ramp-up (sec) | Ramp-up + Duration | How long to sustain peak load after ramping up | 3600 |
| Ramp-up Duration (sec) | Ramp-up, Ramp-up + Duration | Total time to reach target concurrency | 3600 |
| Ramp-up Steps | Ramp-up, Ramp-up + Duration | Number of concurrency increments during ramp-up | Target VUs |
| Delay between waves (ms) | All | Think-time / pacing pause between rounds of requests | 300000 |
All settings are locked once a test is running - stop the test to change configuration.
▶️ Running a test
- Go to the Setup tab.
- Choose your Scope and select the request(s).
- Choose a Load Model and fill in its fields.
- Click Start Test. You're automatically switched to the Results tab.
- Watch the live metrics update as waves of requests complete.
- Click Stop at any time to cancel early - results gathered so far are kept and can still be exported.
- When the test finishes (or you stop it), the status changes to Completed or Cancelled, and the Export button becomes available.
📊 Reading the results
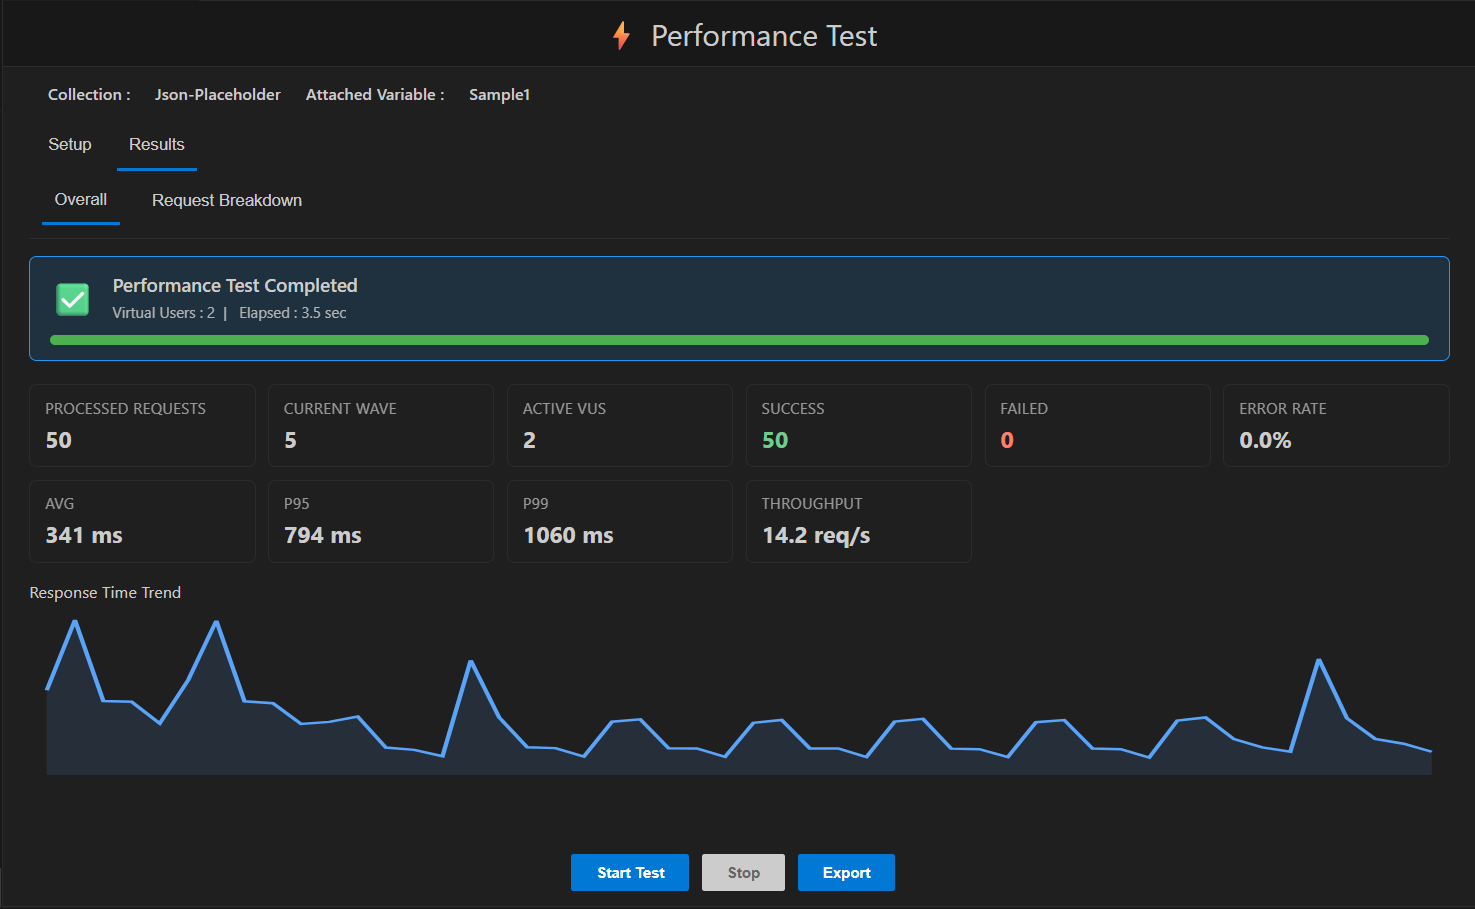
📋 Summary cards
| Card | Meaning |
|---|---|
| Total Requests | Every request sent so far, across all virtual users |
| Success | Requests that returned a status below 400 with no connection error |
| Failed | Requests that errored (timeout, connection failure) or returned status ≥ 400 |
| Error Rate | Failed ÷ Total, as a percentage |
| Avg | Mean response time across all requests |
| P95 | 95% of requests completed at or below this response time |
| P99 | 99% of requests completed at or below this response time |
| Throughput | Requests completed per second (RPS) so far |
Why percentiles matter more than averages: an average can hide a small number of very slow requests. P95/P99 tell you what your slowest real users are experiencing - a much better indicator of perceived performance than the average alone.
📉 Response Time Trend chart
A running line chart of individual response times over the course of the test. Useful for spotting:
- Gradual degradation (a rising line as the test progresses)
- Sudden spikes tied to a specific point in a ramp-up
- Instability (a consistently jagged, wide-ranging line)
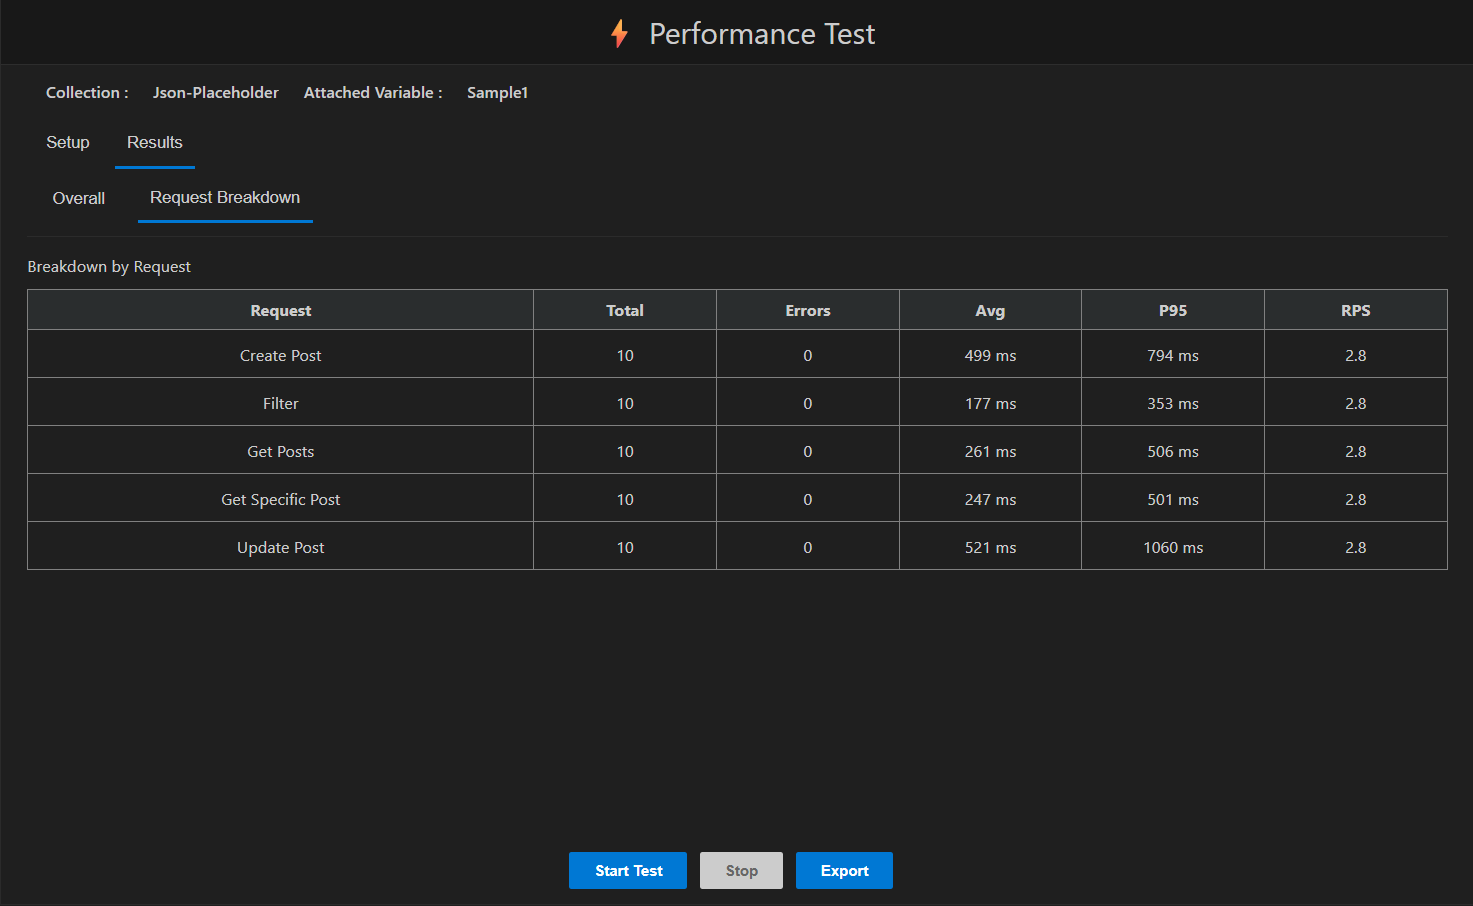
🧩 Breakdown by Request
Shown automatically whenever more than one distinct request is in scope (i.e. Whole Collection/Folder mode with multiple requests selected). Gives per-endpoint numbers - total, errors, average, P95, and RPS - so you can identify which specific endpoint is the bottleneck rather than only seeing an aggregate.
📤 Exporting results
Once a test is Completed or Cancelled, use the Export dropdown in the footer:
| Format | Best for |
|---|---|
| JSON | A complete record of the run - your test configuration, summary metrics, per-endpoint breakdown, and every individual raw result. Good for archiving a full run or feeding into another analysis tool. |
| CSV | Summary metrics and per-endpoint breakdown in a spreadsheet-friendly format. Good for quick sharing or comparing runs side by side in Excel/Sheets. |
| HTML | A shareable, readable report you can open in a browser or send to teammates. |
| XML | A structured export for tools that expect XML. |
💡 Choosing the right load model - quick guide
| Your goal | Use this model |
|---|---|
| "Run the same test the same way every time" | Fixed Iterations |
| "Will this hold up under sustained everyday traffic?" | Duration |
| "At what point does this start to break?" | Ramp-up |
| "Simulate real-world traffic building up to peak and staying there" | Ramp-up + Duration |
⚠️ Limitations
- Maximum 50 concurrent virtual users per test, to keep load generation from overwhelming your own machine or network.
- Pre-request scripts are skipped for both scopes during a performance test.
- Test-script assertions (pass/fail checks) are not evaluated per response during a performance test - success/failure is determined purely by HTTP status and connection errors. This keeps overhead low at high concurrency. Use the regular Run/Run All feature if you need functional assertion results.
- Response times reflect round-trip time as seen from your machine, including local network conditions - not a substitute for server-side APM tooling.